使用 MSMBuilder 进行数据聚类

  之前的一篇博文讲述了通过scipy.cluster进行聚类,最近发现MSMBuilder也具有类似的功能,并且使用比较方便,遂记录于此。

准备工作

  在构建 MSM 的过程中,一般会有如下降维的步骤:

1
2
3
4
5
6
7
8
9
10
11
12
13
14
15
16
17
18
from msmbuilder.featurizer import RawPositionsFeaturizer
from msmbuilder.decomposition import PCA
from msmbuilder.cluster import MiniBatchKMeans

featurizer = RawPositionsFeaturizer(atom_indices=atoms)
feat = featurizer.fit_transform(trajs) # trajs 为列表,每个元素为一条轨迹;feat 为列表,每个元素为 帧数* 特征数 的 2D array

pca = PCA(n_components=2)
pca_traj = pca.fit_transform(feat) # pca_traj 为列表,长度为轨迹条数;每个元素为 帧数 * n_components 的 2D array
pca_data=np.concatenate(pca_traj)

# 开始聚类
n_clusters=200
clusterer = MiniBatchKMeans(n_clusters=n_clusters, random_state=1)
clustered_traj = clusterer.fit(pca_traj) # pca_traj 为列表

clusterer.labels_ # 聚类标签
clusterer.cluster_centers_ # 聚类中心
  先使用RawPositionsFeaturizer提取特征,然后使用PCA进行降维,再使用MiniBatchKMeans进行聚类。需要注意的是: 1. clusterer.fit(pca_traj) 表示使用pca_traj来 fit 模型的参数 2. clusterer.transform(new_data) 表示计算 new_data 在这个模型上的投影 3. pca_traj 是一个列表,它的每一个元素是一组数据 4. 除了MiniBatchKMeans之外,msmbuilder 还提供了其它的聚类方案:

API Description
KCenters K-Centers clustering
KMeans K-Means clustering
KMedoids K-Medoids clustering
MiniBatchKMedoids Mini-Batch K-Medoids clustering
RegularSpatial Regular spatial clustering
LandmarkAgglomerative Landmark-based agglomerative hierarchical clustering
AffinityPropagation Perform Affinity Propagation Clustering of data
GMM Gaussian Mixture
MeanShift Mean shift clustering using a flat kernel
MiniBatchKMeans Mini-Batch K-Means clustering
SpectralClustering Apply clustering to a projection to the normalized laplacian
Ward

测试

1
2
3
4
5
6
7
8
9
10
11
12
13
14
15
16
17
18
19
20
21
22
23
24
25
26
27
28
29
30
31
32
33
34
35
36
37
38
39
40
41
42
43
44
45
46
47
48
49
50
51
52
53
54
55
56
57
58
59
60
61
62
63
64
65
66
67
68
69
70
71
72
73
74
75
76
77
78
79
80
81
82
83
84
85
86
%pylab 

from msmbuilder.cluster import MiniBatchKMeans

######## generate data
## 矩形
n=200000
np.random.seed(100)
pos1=np.random.random(size=(n,2)) # position

# 闭合圆环
n=100000
def gen_circle(radii,n):
np.random.seed(200+int(radii))
p=np.random.random(size=(n,2)) # position
r=(p[:,0]+radii)/8
theta=p[:,1]*2*np.pi
return np.column_stack((r*np.cos(theta),r*np.sin(theta)))

p1=gen_circle(radii=1,n=n)
p2=gen_circle(radii=3,n=n)
pos2=np.concatenate((p1,p2))

# 半环
n=100000
def gen_open(top,n):
np.random.seed(300+int(top))
p=np.random.random(size=(n,2)) # position
x=p[:,0]*np.pi
y=np.sin(x)+p[:,1]*0.2
if top:
return np.column_stack((x,y-0.4))
else:
return np.column_stack((x+np.pi/2,-1*y+0.4))

p1=gen_open(top=1,n=n)
p2=gen_open(top=0,n=n)
pos3=np.concatenate((p1,p2))

######## plot data
from msmbuilder.cluster import KCenters
from msmbuilder.cluster import KMeans
from msmbuilder.cluster import KMedoids
from msmbuilder.cluster import MiniBatchKMedoids
from msmbuilder.cluster import RegularSpatial
from msmbuilder.cluster import LandmarkAgglomerative
from msmbuilder.cluster import AffinityPropagation
from msmbuilder.cluster import GMM
from msmbuilder.cluster import MeanShift
from msmbuilder.cluster import MiniBatchKMeans
from msmbuilder.cluster import SpectralClustering

def plot_cluster(data,method,n_clusters,ax):
#clusterer = MiniBatchKMeans(n_clusters=n_clusters, random_state=1)
clusterer = eval('%s(n_clusters=%d, random_state=1)'%(method,n_clusters))
print(clusterer)
clustered_traj = clusterer.fit([data])
#clusterer.labels_ # 聚类标签
#clusterer.cluster_centers_ # 聚类中心
labels=clusterer.labels_[0]

cmap = plt.cm.jet
norm = matplotlib.colors.Normalize(vmin=labels.min(), vmax=labels.max())
ax.scatter(data[:,0],data[:,1],c=cmap(norm(labels)))
ax.set_xticks([])
ax.set_yticks([])
ax.set_xticklabels([])
ax.set_yticklabels([])

#
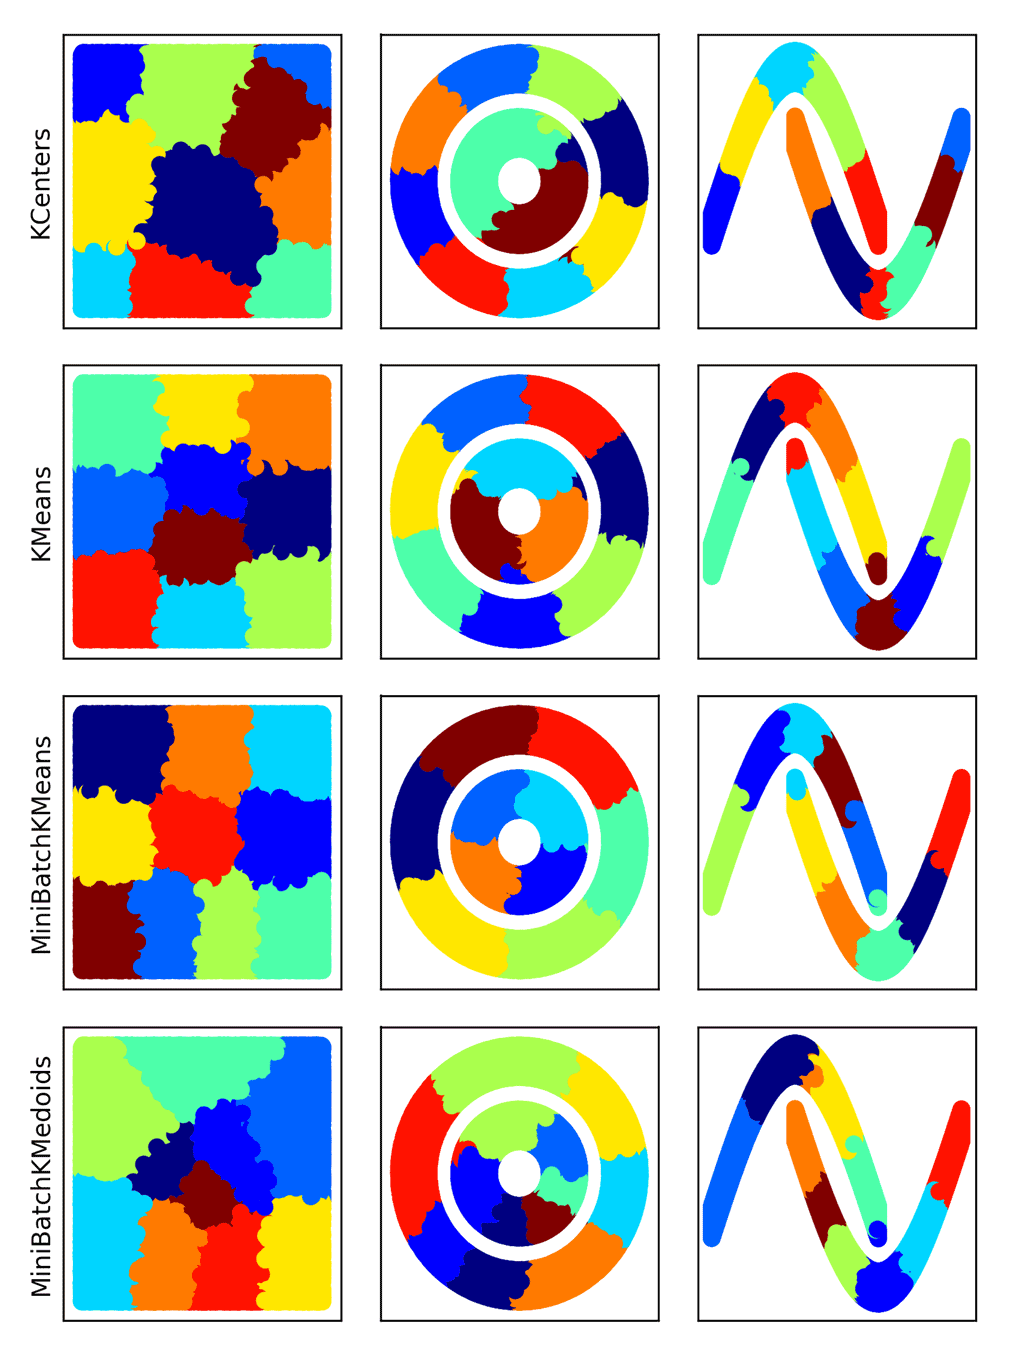
methods=['KCenters','KMeans','MiniBatchKMeans','MiniBatchKMedoids']

for method in methods:
try:
fig,axes=plt.subplots(figsize=(5.6,2),nrows=1,ncols=3)
axes=axes.ravel()
#method='MiniBatchKMeans'
axes[0].set_ylabel(method)
plot_cluster(data=pos1,method=method,n_clusters=10,ax=axes[0])
plot_cluster(data=pos2,method=method,n_clusters=10,ax=axes[1])
plot_cluster(data=pos3,method=method,n_clusters=10,ax=axes[2])
plt.tight_layout()
plt.savefig(method+'.png',dpi=300)
plt.close()
except:
print('Error: %s\n\n'%method)

效果如下: 20190831-msmbuilder_cluster.png